Database observability: every number read from Postgres itself
Each project now has an Observability page charting its database's connections, transactions, row activity, cache hit ratio and table health, all read from Postgres's own statistics.
Try WyroUntil today, the only thing Wyro told you about a running database was how much disk it used. That tells you nothing about whether the app in front of it is healthy. Every project now has an Observability page. It shows what the database is doing right now and what it has been doing, in the same stacked-bar format you may know from other Postgres dashboards.
What is on the page
- Connections by state: active, idle, idle in transaction and other, read from
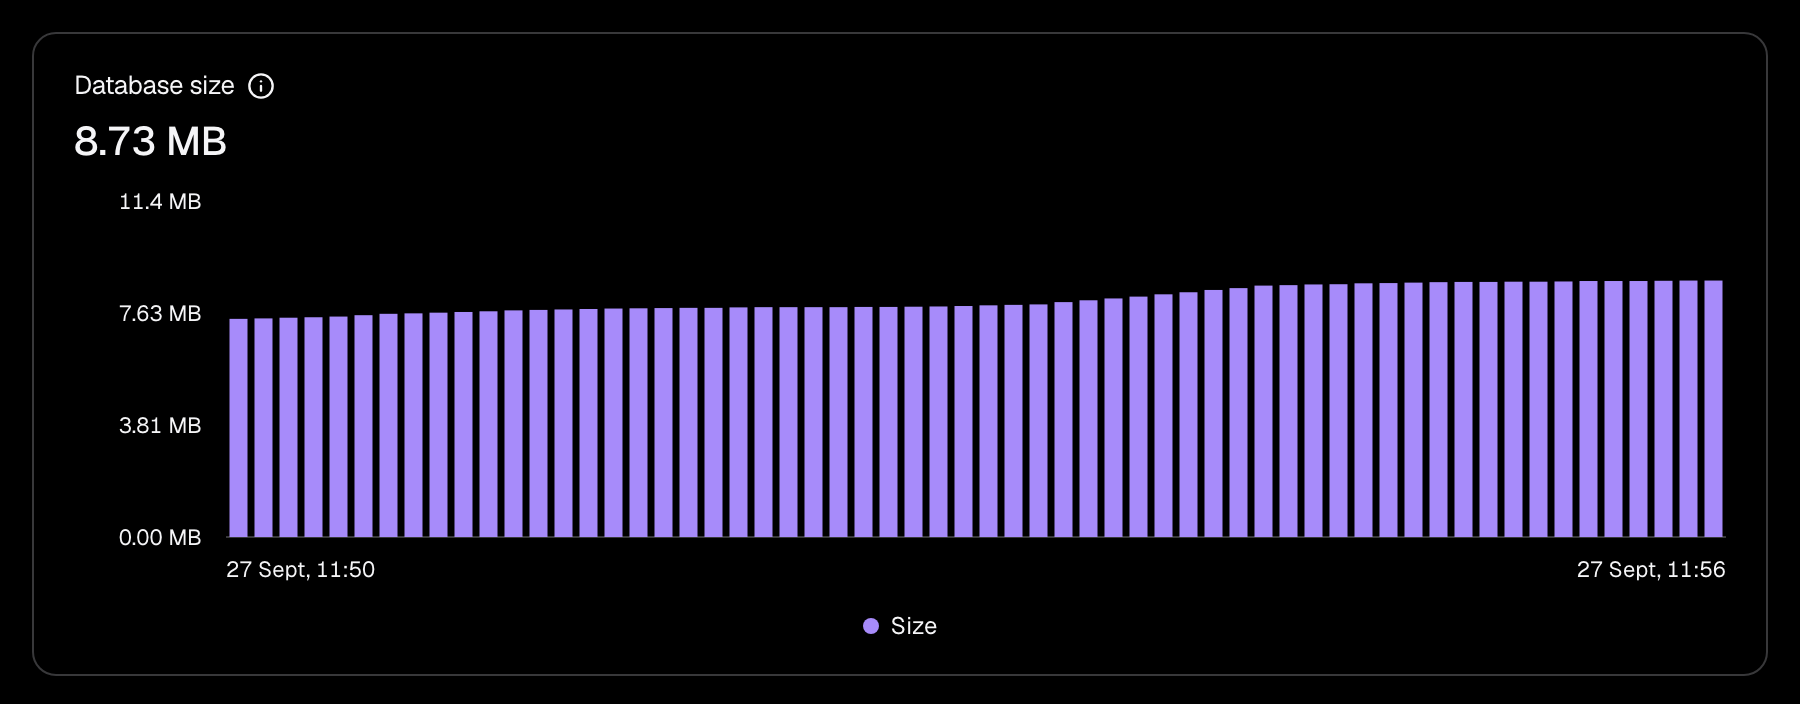
pg_stat_activity, against the server'smax_connections. Wyro's own reading session is left out, so the count is only your apps' connections. - Database size: from
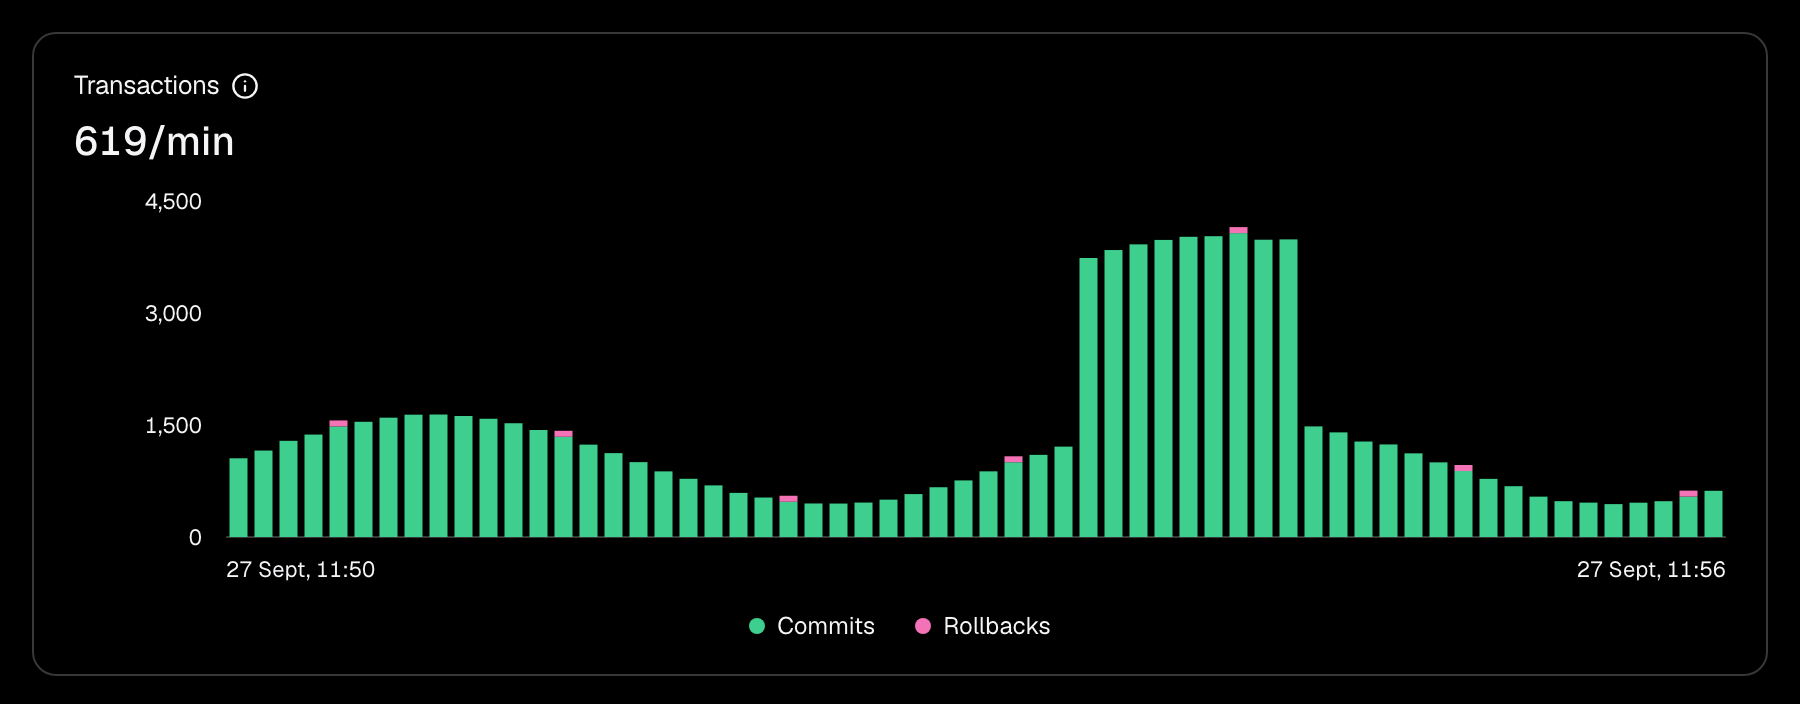
pg_database_size(), with your plan's storage limit drawn as a dashed line once you are close enough for it to matter. - Transactions per minute: commits and rollbacks. A rising rollback share is usually failing requests.
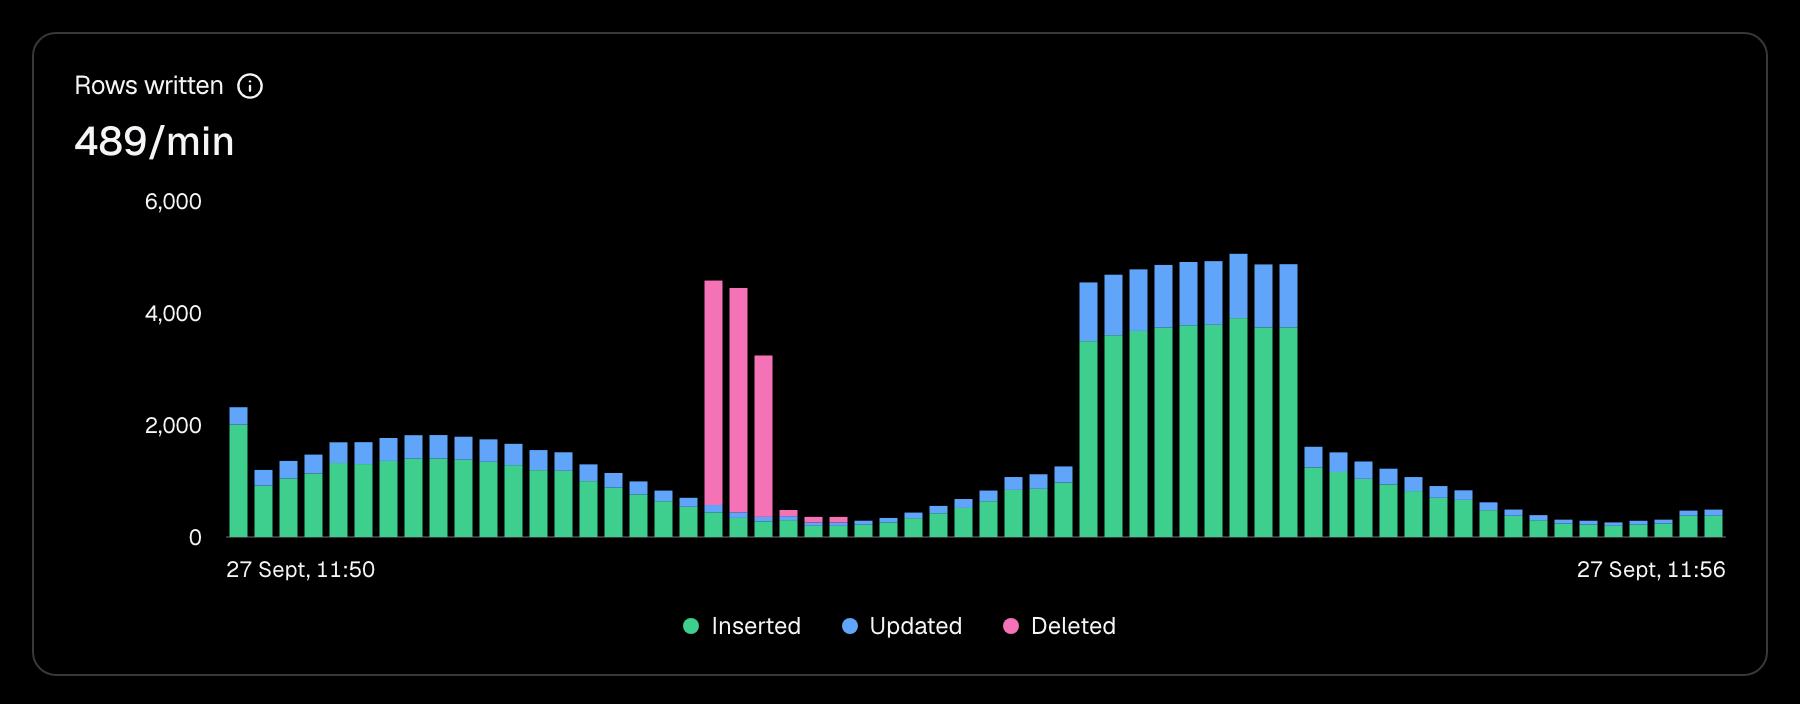
- Rows written per minute: inserted, updated and deleted.
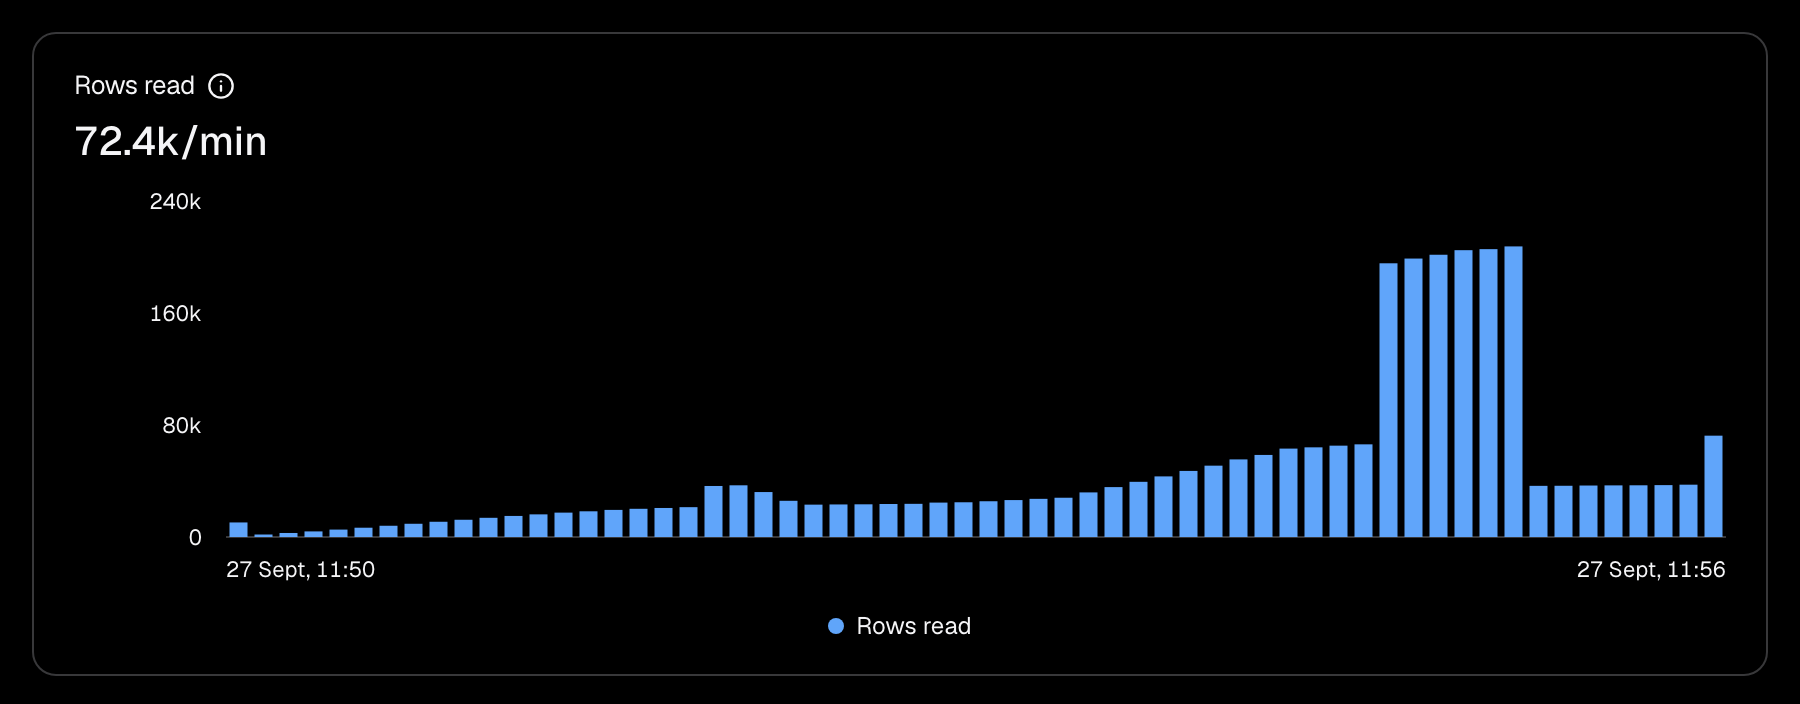
- Rows read per minute: a read spike with no matching traffic spike is usually a missing index.
- Cache hit ratio: the share of block reads served from shared buffers rather than disk.
- Largest tables: size, live and dead rows, sequential scans vs index scans, and when each table was last vacuumed.
How the rates are measured
Postgres keeps running totals in pg_stat_database: every commit, every row inserted, every block read since the statistics were last reset. A single reading of a total says nothing. A rate is the difference between two readings divided by the real time between them, and that is the only arithmetic the page does. Each bar is exact for the interval it covers, even when readings are unevenly spaced.
The totals sometimes restart from zero, after pg_stat_reset() or when a suspended Neon compute wakes up. A reading lower than the one before it therefore means the counter was reset in between. The page counts only what built up after the reset. That is a true lower bound, never a negative rate.
What it will not show you, and why
There is no CPU or memory chart. A managed database gives Wyro a Postgres role, not a machine, and no SQL query reports the compute's RAM. A memory chart would have to be a guess, and a dashboard that guesses teaches you to ignore it.
Gaps are also left as gaps. The page takes a reading once a minute while it is open, and does not poll in the background. Polling every database every minute would keep every idle Neon compute awake, and paying for compute, around the clock. So an empty stretch on the chart means nobody took a reading then. It does not mean the database was idle, and the page never fills that stretch with an average. When two readings are more than half an hour apart, the interval between them gets no rate at all, rather than a flat line that makes a burst look like steady load.
Everything that shipped
- NewObservability page per project: connections, size, transactions, rows read and written, cache hit ratio, largest tables.
- NewReadings recorded once a minute while the page is open and kept for eight days, with rates taken from consecutive readings.
- NewCounter resets (stats reset, compute restart) are detected and never produce negative rates.
- ImprovedThe dashboard's dropdowns and tooltips are now built on shadcn/ui and use Wyro's own theme.
Author

Dominic PaulCEO | Founder